pyagrum.lib.explain
The purpose of pyagrum.lib.explain is to give tools to explain and interpret the structure and parameters of a Bayesian network.
Dealing with independence
Section titled “Dealing with independence”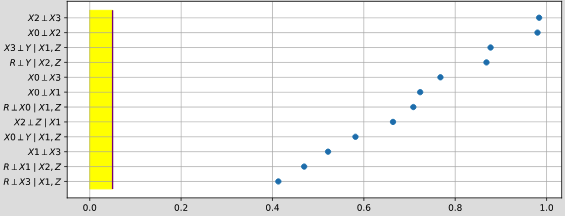
pyagrum.lib.explain.independenceListForPairs(bn, filename, target=None, plot=True, alphabetic=False)
Section titled “pyagrum.lib.explain.independenceListForPairs(bn, filename, target=None, plot=True, alphabetic=False)”get the p-values of the chi2 test of a (as simple as possible) independence proposition for every non arc.
- Parameters:
- bn (gum.BayesNet) – the Bayesian network
- filename (str) – the name of the csv database
- alphabetic (bool) – if True, the list is alphabetically sorted else it is sorted by the p-value
- target ( (**optional ) str or int) – the name or id of the target variable
- plot (bool) – if True, plot the result
- Returns: the list
Dealing with mutual information and entropy
Section titled “Dealing with mutual information and entropy”
pyagrum.lib.explain.getInformation(bn, evs=None, size=None, cmap=<matplotlib.colors.LinearSegmentedColormap object>)
Section titled “pyagrum.lib.explain.getInformation(bn, evs=None, size=None, cmap=<matplotlib.colors.LinearSegmentedColormap object>)”get a HTML string for a bn annotated with results from inference : entropy and mutual information
- Parameters:
- bn (pyagrum.BayesNet) – the model
- evs (Dict [**str |**int ,**str |**int |**List [**float ] ]) – the observations
- size (int |**str) – size of the rendered graph
- cmap (matplotlib.colours.Colormap) – the cmap
- Returns: return the HTML string
- Return type: str
pyagrum.lib.explain.showInformation(bn, evs=None, size=None, cmap=<matplotlib.colors.LinearSegmentedColormap object>)
Section titled “pyagrum.lib.explain.showInformation(bn, evs=None, size=None, cmap=<matplotlib.colors.LinearSegmentedColormap object>)”diplay a bn annotated with results from inference : entropy and mutual information
- Parameters:
- bn (pyagrum.BayesNet) – the model
- evs (Dict [**str |**int ,**str |**int |**List [**float ] ]) – the observations
- size (int |**str) – size of the rendered graph
- cmap (matplotlib.colours.Colormap) – the cmap
Dealing with ShapValues
Section titled “Dealing with ShapValues”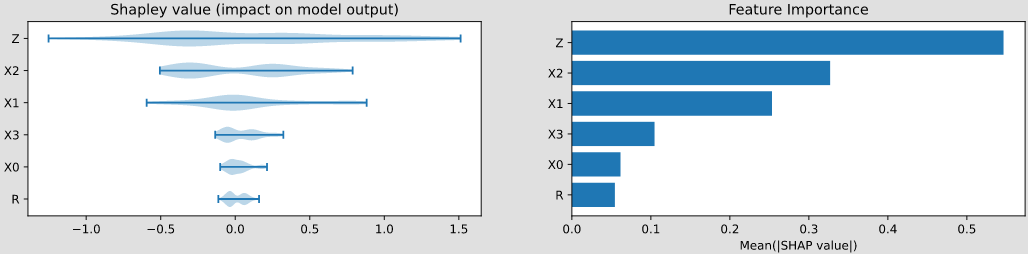
class pyagrum.lib.explain.ShapValues(bn, target, logit=True)
Section titled “class pyagrum.lib.explain.ShapValues(bn, target, logit=True)”Bases: object
Class to compute Shapley values for a target variable in a Bayesian network.
causal(df, y=1, sample_size=200, plot=False, plot_importance=False, percentage=False, filename=None)
Section titled “causal(df, y=1, sample_size=200, plot=False, plot_importance=False, percentage=False, filename=None)”Computes the causal Shapley values for each variable.
Parameters:
Section titled “Parameters:”df : The input data for which to compute the Shapley values.
y : The target class for which to compute the Shapley values (default is 1).
sample_size : The number of samples to use for the background data (default is 200).
plot : If True, plots the waterfall or beeswarm plot depending on the number of rows in df (default is False).
plot_importance : If True, plots the bar chart of feature importance (default is False).
percentage: bool : if True, the importance plot is shown in percent.
filename : If provided, saves the plots to the specified filename instead of displaying them.
Returns:
Section titled “Returns:”: Dict[str, float]
A dictionary containing the importances of each variable in the input data.
- param percentage:
- type percentage:
bool - param filename:
- type filename:
str
conditional(df, y=1, plot=False, plot_importance=False, percentage=False, filename=None)
Section titled “conditional(df, y=1, plot=False, plot_importance=False, percentage=False, filename=None)”Computes the conditional Shapley values for each variable.
Parameters:
Section titled “Parameters:”df : The input data for which to compute the Shapley values.
y : The target class for which to compute the Shapley values (default is 1).
plot : If True, plots the waterfall or beeswarm plot depending on the number of rows in df (default is False).
plot_importance : If True, plots the bar chart of feature importance (default is False).
percentage: bool : if True, the importance plot is shown in percent.
filename : If provided, saves the plots to the specified filename instead of displaying them.
Returns:
Section titled “Returns:”: Dict[str, float]
A dictionary containing the importances of each variable in the input data.
- param y:
- type y:
int - param plot:
- type plot:
bool - param plot_importance:
- type plot_importance:
bool - param percentage:
- type percentage:
bool - param filename:
- type filename:
str
marginal(df, y=1, sample_size=200, plot=False, plot_importance=False, percentage=False, filename=None)
Section titled “marginal(df, y=1, sample_size=200, plot=False, plot_importance=False, percentage=False, filename=None)”Computes the marginal Shapley values for each variable.
Parameters:
Section titled “Parameters:”df : The input data for which to compute the Shapley values.
y : The target class for which to compute the Shapley values (default is 1).
sample_size : The number of samples to use for the background data (default is 200).
plot : If True, plots the waterfall or beeswarm plot depending on the number of rows in df (default is False).
plot_importance : If True, plots the bar chart of feature importance (default is False).
percentage: bool : if True, the importance plot is shown in percent.
Returns:
Section titled “Returns:”: Dict[str, float]
A dictionary containing the importances of each variable in the input data.
- param percentage:
- type percentage:
bool - param filename:
- type filename:
str
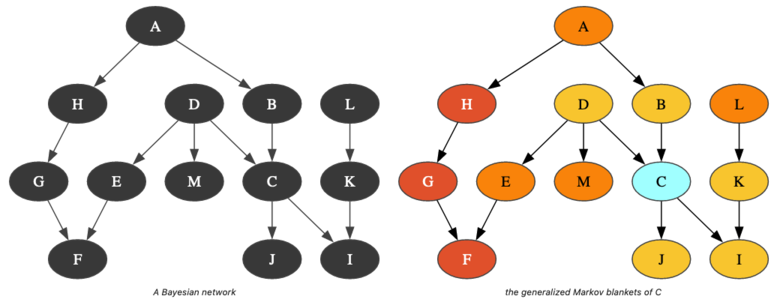
Dealing with generalized Markov Blankets
Section titled “Dealing with generalized Markov Blankets”A structural property of Bayesian networks is the Markov boundary of a node. A Markov blanket of a node is a set of nodes that renders the node independent of all other nodes in the network. The Markov boundary is the closest Markov blanket. A Markov boundary of a node is composed of its parents, its children, and the parents of its children. More generally, one can define the generalized -Markov blanket of a node as the union of the markov blanket of the nodes of its -Markov blanket. So, if a node belongs to the -Markov blanket of the node , is a kind of measure of its proximity to .