


pyagrum.explain
The purpose of pyagrum.explain is to give tools to explain and interpret the structure and
parameters of a Bayesian network.
Dealing with independence
Section titled “Dealing with independence”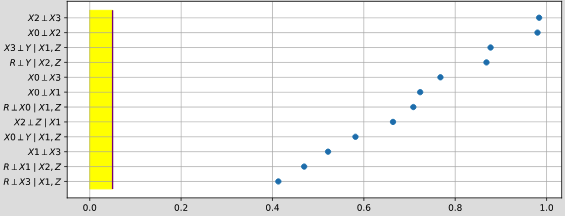
pyagrum.explain.independenceListForPairs(bn, filename, target=None, plot=True, alphabetic=False)
Section titled “pyagrum.explain.independenceListForPairs(bn, filename, target=None, plot=True, alphabetic=False)”get the p-values of the chi2 test of a (as simple as possible) independence proposition for every non arc.
- Parameters:
- bn (pyagrum.BayesNet) – the Bayesian network
- filename (str) – the name of the csv database
- alphabetic (bool) – if True, the list is alphabetically sorted else it is sorted by the p-value
- target ( *(*optional ) str or int) – the name or id of the target variable
- plot (bool) – if True, plot the result
- Returns: the list
Dealing with mutual information and entropy
Section titled “Dealing with mutual information and entropy”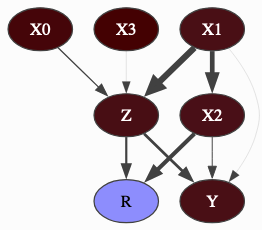
pyagrum.explain.getInformation(bn, evs=None, size=None, cmap=<matplotlib.colors.LinearSegmentedColormap object>)
Section titled “pyagrum.explain.getInformation(bn, evs=None, size=None, cmap=<matplotlib.colors.LinearSegmentedColormap object>)”get a HTML string for a bn annotated with results from inference : entropy and mutual information
- Parameters:
- bn (pyagrum.BayesNet) – the model
- evs (dict *[*str *|*int *,*str *|*int *|*list *[*float ] ]) – the observations
- size (int *|*str) – size of the rendered graph
- cmap (matplotlib.colours.Colormap) – the cmap
- Returns: return the HTML string
- Return type:
str
pyagrum.explain.getInformationGraph(bn, evs=None, size=None, cmap=<matplotlib.colors.LinearSegmentedColormap object>, withMinMax=False)
Section titled “pyagrum.explain.getInformationGraph(bn, evs=None, size=None, cmap=<matplotlib.colors.LinearSegmentedColormap object>, withMinMax=False)”Create a dot representation of the information graph for this BN
- Parameters:
- bn (pyagrum.BayesNet) – the BN
- evs (dict *[*str *,*str *|*int *|*list *[*float ] ]) – map of evidence
- size (str *|*int) – size of the graph
- cmap (matplotlib.colors.Colormap) – color map
- withMinMax (bool) – min and max in the return values ?
- Returns: graph as a dot representation and if asked, min_information_value, max_information_value, min_mutual_information_value, max_mutual_information_value
- Return type: dot.Dot | tuple[dot.Dot,float,float,float,float]
pyagrum.explain.showInformation(bn, evs=None, size=None, cmap=<matplotlib.colors.LinearSegmentedColormap object>, show_legend=True)
Section titled “pyagrum.explain.showInformation(bn, evs=None, size=None, cmap=<matplotlib.colors.LinearSegmentedColormap object>, show_legend=True)”Display a bn annotated with results from inference : entropy and mutual information.
Node color encodes entropy; arc width encodes mutual information between endpoints.
- Parameters:
- bn (pyagrum.BayesNet) – the model
- evs (dict *[*str *|*int *,*str *|*int *|*list *[*float ] ]) – the observations
- size (int *|*str) – size of the rendered graph
- cmap (matplotlib.colours.Colormap) – the cmap
- show_legend (bool) – if True, display a colorbar for entropy and an arc-width scale for mutual information (default is False)
Dealing with Shap Values and Shall Values
Section titled “Dealing with Shap Values and Shall Values”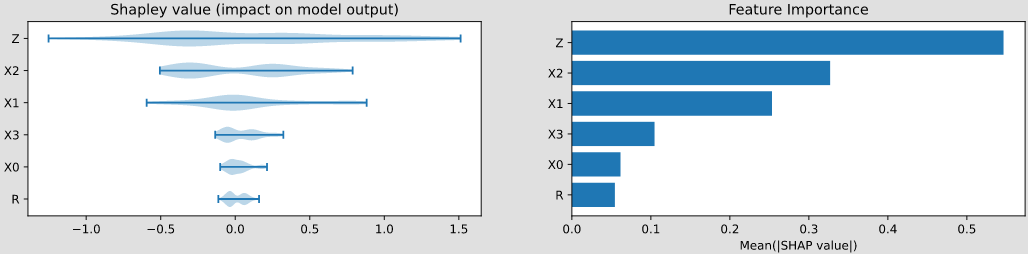
All attribution methods return an Explanation object, which maps
feature names to their individual attribution values and carries auxiliary data from the
computation.
class pyagrum.explain.Explanation(values, importances, feature_names, data, baseline, func, values_type)
Section titled “class pyagrum.explain.Explanation(values, importances, feature_names, data, baseline, func, values_type)”Structured container for the result of a Shap/Shall explanation.
Acts as a mapping from feature names to their attribution values, and also carries the auxiliary data produced during the computation.
Shap Values
Section titled “Shap Values”Shap (SHapley Additive exPlanations) values decompose a model prediction into the additive contributions of each feature, based on the Shapley value from cooperative game theory. Three variants are available depending on how feature interactions are handled:
class pyagrum.explain.MarginalShapValues(bn, target, background, sample_size=1000, logit=True)
Section titled “class pyagrum.explain.MarginalShapValues(bn, target, background, sample_size=1000, logit=True)”Bases: ShapleyValues, MarginalComputation
The MarginalShapValues class computes the Marginal Shapley values for a given target node in a Bayesian Network.
- Parameters:
- bn (
BayesNet) - target (
int) - background (
DataFrame|tuple|None)
- bn (
compute(data, N=100)
Section titled “compute(data, N=100)”Computes the Shapley values for the target node based on the provided data.
- Parameters:
- data (
DataFrame|Series|dict|tuple|None) – Data to explain. A plain DataFrame/Series/dict is treated as (data, True) (labels assumed). A tuple allows explicit control: (data, with_labels). If None, a random sample of size N is generated. - N (int) – The number of samples to generate if data is None.
- data (
- Returns: An Explanation object containing the Shapley values and importances for the target node.
- Return type: Explanation
- Raises:
- TypeError – If the first element of data is not a pd.DataFrame, pd.Series or dict, or if N is not an integer when data is None.
- ValueError – If N is less than 2 when data is None.
class pyagrum.explain.ConditionalShapValues(bn, target, logit=True)
Section titled “class pyagrum.explain.ConditionalShapValues(bn, target, logit=True)”Bases: ShapleyValues
The ConditionalShapValues class computes the conditional Shapley values for a given target node in a Bayesian Network.
compute(data, N=100)
Section titled “compute(data, N=100)”Computes the Shapley values for the target node based on the provided data.
- Parameters:
- data (
DataFrame|Series|dict|tuple|None) – Data to explain. A plain DataFrame/Series/dict is treated as (data, True) (labels assumed). A tuple allows explicit control: (data, with_labels). If None, a random sample of size N is generated. - N (int) – The number of samples to generate if data is None.
- data (
- Returns: An Explanation object containing the Shapley values and importances for the target node.
- Return type: Explanation
- Raises:
- TypeError – If the first element of data is not a pd.DataFrame, pd.Series or dict, or if N is not an integer when data is None.
- ValueError – If N is less than 2 when data is None.
The causal Shapley values are computed following Heskes et al. [HSBC20].
class pyagrum.explain.CausalShapValues(bn, target, background, sample_size=1000, logit=True)
Section titled “class pyagrum.explain.CausalShapValues(bn, target, background, sample_size=1000, logit=True)”Bases: ShapleyValues, CausalComputation
The CausalShapValues class computes the Causal Shapley values for a given target node in a Bayesian Network.
- Parameters:
background (
DataFrame|tuple|None)
compute(data, N=100)
Section titled “compute(data, N=100)”Computes the Shapley values for the target node based on the provided data.
- Parameters:
- data (
DataFrame|Series|dict|tuple|None) – Data to explain. A plain DataFrame/Series/dict is treated as (data, True) (labels assumed). A tuple allows explicit control: (data, with_labels). If None, a random sample of size N is generated. - N (int) – The number of samples to generate if data is None.
- data (
- Returns: An Explanation object containing the Shapley values and importances for the target node.
- Return type: Explanation
- Raises:
- TypeError – If the first element of data is not a pd.DataFrame, pd.Series or dict, or if N is not an integer when data is None.
- ValueError – If N is less than 2 when data is None.
Shall Values
Section titled “Shall Values”Shall (SHapley Additive Log-Likelihood) values are a pyAgrum-specific explanation method. Where Shap values attribute a prediction, Shall values attribute the log-likelihood of a baseline observation: they decompose — the log-probability of an evidence — into the additive contribution of each variable. This makes them particularly suited for explaining why a given observation is more or less probable under the model, rather than explaining a prediction output.
The same three variants (marginal, conditional, causal) are available:
class pyagrum.explain.MarginalShallValues(bn, background, sample_size=1000, log=True)
Section titled “class pyagrum.explain.MarginalShallValues(bn, background, sample_size=1000, log=True)”Bases: ShallValues, MarginalComputation
The MarginalShallValues class computes the Marginal Shall values in a Bayesian Network.
- Parameters:
- bn (
BayesNet) - background (
tuple|None) - sample_size (
int) - log (
bool)
- bn (
compute(data, N=100)
Section titled “compute(data, N=100)”Computes the SHALL values for all rows in the provided data.
Notes
- Since this is a partial explanation, all rows in data must contain all variables present in the initialized Bayesian Network.
- All rows containing NaN values in columns corresponding to variables in the Bayesian Network will be dropped.
- Parameters:
- data (
DataFrame|Series|dict|tuple|None) – Data to explain. A plain DataFrame/Series/dict is treated as (data, True) (labels assumed). A tuple allows explicit control: (data, with_labels). If None, a random sample of size N is generated. - N (
int) – The number of samples to generate if data is None.
- data (
- Returns: An Explanation object containing the SHALL values and variable importances for each row in the data, after rows with NaN values have been dropped.
- Return type: Explanation
- Raises:
- TypeError – If the first element of data is not a pd.DataFrame, pd.Series or dict, or if N is not an integer when data is None.
- ValueError – If N is less than 2 when data is None, or if the provided data does not contain all variables present in the initialized Bayesian Network.
class pyagrum.explain.ConditionalShallValues(bn, background, sample_size=1000, log=True)
Section titled “class pyagrum.explain.ConditionalShallValues(bn, background, sample_size=1000, log=True)”Bases: ShallValues, ConditionalComputation
The ConditionalShallValues class computes the conditional Shall values in a Bayesian Network.
- Parameters:
- bn (
BayesNet) - background (
tuple|None) - sample_size (
int) - log (
bool)
- bn (
compute(data, N=100)
Section titled “compute(data, N=100)”Computes the SHALL values for all rows in the provided data.
Notes
- Since this is a partial explanation, all rows in data must contain all variables present in the initialized Bayesian Network.
- All rows containing NaN values in columns corresponding to variables in the Bayesian Network will be dropped.
- Parameters:
- data (
DataFrame|Series|dict|tuple|None) – Data to explain. A plain DataFrame/Series/dict is treated as (data, True) (labels assumed). A tuple allows explicit control: (data, with_labels). If None, a random sample of size N is generated. - N (
int) – The number of samples to generate if data is None.
- data (
- Returns: An Explanation object containing the SHALL values and variable importances for each row in the data, after rows with NaN values have been dropped.
- Return type: Explanation
- Raises:
- TypeError – If the first element of data is not a pd.DataFrame, pd.Series or dict, or if N is not an integer when data is None.
- ValueError – If N is less than 2 when data is None, or if the provided data does not contain all variables present in the initialized Bayesian Network.
class pyagrum.explain.CausalShallValues(bn, background, sample_size=1000, log=True)
Section titled “class pyagrum.explain.CausalShallValues(bn, background, sample_size=1000, log=True)”Bases: ShallValues, CausalComputation
The CausalShallValues class computes the Causal Shall values in a Bayesian Network.
- Parameters:
- bn (
BayesNet) - background (
tuple|None) - sample_size (
int) - log (
bool)
- bn (
compute(data, N=100)
Section titled “compute(data, N=100)”Computes the SHALL values for all rows in the provided data.
Notes
- Since this is a partial explanation, all rows in data must contain all variables present in the initialized Bayesian Network.
- All rows containing NaN values in columns corresponding to variables in the Bayesian Network will be dropped.
- Parameters:
- data (
DataFrame|Series|dict|tuple|None) – Data to explain. A plain DataFrame/Series/dict is treated as (data, True) (labels assumed). A tuple allows explicit control: (data, with_labels). If None, a random sample of size N is generated. - N (
int) – The number of samples to generate if data is None.
- data (
- Returns: An Explanation object containing the SHALL values and variable importances for each row in the data, after rows with NaN values have been dropped.
- Return type: Explanation
- Raises:
- TypeError – If the first element of data is not a pd.DataFrame, pd.Series or dict, or if N is not an integer when data is None.
- ValueError – If N is less than 2 when data is None, or if the provided data does not contain all variables present in the initialized Bayesian Network.
Dealing with generalized Markov Blankets
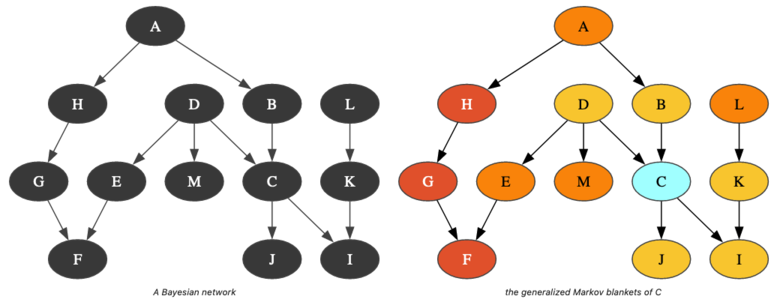
Section titled “Dealing with generalized Markov Blankets”A structural property of Bayesian networks is the Markov boundary of a node. A Markov blanket of a node is a set of nodes that renders the node independent of all other nodes in the network. The Markov boundary is the closest Markov blanket. A Markov boundary of a node is composed of its parents, its children, and the parents of its children. More generally, one can define the generalized -Markov blanket of a node as the union of the markov blanket of the nodes of its -Markov blanket. So, if a node belongs to the -Markov blanket of the node , is a kind of measure of its proximity to .
pyagrum.explain.generalizedMarkovBlanket(bn, var, k=1, cmapNode=None)
Section titled “pyagrum.explain.generalizedMarkovBlanket(bn, var, k=1, cmapNode=None)”Build a pydot.Dot representation of the nested Markov Blankets (of order k) of node x
Warning
It is assumed that k<=8. If not, every thing is fine except that the colorscale will change in order to accept more colors.
- Parameters:
- bn (pyagrum.DirectedGraphicalModel) – i.e. a class with methods parents, children, variable(i), idFromName(name)
- var (
int|str) – the name or nodeId of the node for the Markov blanket - k (
int) – the order of the Markov blanket. If k=1, build the MarkovBlanket(MarkovBlanket()) - cmap (maplotlib.ColorMap) – the colormap used (if not, inferno is used)
- Returns: pydotplus.Dot object