

Export and visualize Graphical models and Tensors (png, pdf)
pyagrum.lib.image aims to graphically export models and inference using pydot (and then graphviz).
import pyagrum as gumfrom pyagrum.lib.image as gumimage
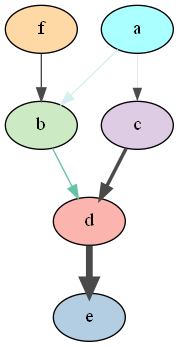
bn = gum.fastBN("a->b->d;a->c->d[3]->e;f->b")gumimage.export(bn,"out/test_export.png",                nodeColor={'a': 1,                           'b': 0.3,                           'c': 0.4,                           'd': 0.1,                           'e': 0.2,                           'f': 0.5},                arcColor={(0, 1): 0.2,                          (1, 2): 0.5},                arcWidth={(0, 3): 0.4,                          (3, 2): 0.5,                          (2,4) :0.6})
Visualization of models and inference
Section titled “Visualization of models and inference”pyagrum.lib.image.export(obj, filename=None, **kwargs)
Section titled “pyagrum.lib.image.export(obj, filename=None, **kwargs)”export a graphical model or an inference or an obj with _repr_html as an image
- Parameters:
- obj (
Any) – the model to export (pyagrum.BayesNet, pyagrum.MarkovRandomField, pyagrum.InfluenceDiagram or pyagrum.Tensor) or a string in dot format or an object with a method _repr_html_() - filename (
str|None) – the name of the resulting file (suffix in [‘pdf’, ‘png’, ‘fig’, ‘jpg’, ‘svg’, ‘ps’]). If filename is None, the result is a np.array ready to be used with imshow().
- obj (
- Return type:
Any
Note
Model can also just possess a method toDot() or even be a simple string in dot syntax.
Note
When exporting in pdf, you can adjust the margin with the config parameters export_pdf_margin_x and export_pdf_margin_y (in pixels, default 40 and 37 resp.). You can also adjust the size of the exported graph with the parameter size (default “8,5!”).
pdf export with custom margin :
pyagrum.config.typed["notebook", "export_pdf_margin_x"] = 40 pyagrum.config.typed["notebook", "export_pdf_margin_y"] = 37
pyagrum.lib.image.exportInference(model, filename=None, **kwargs)
Section titled “pyagrum.lib.image.exportInference(model, filename=None, **kwargs)”the graphical representation of an inference in a notebook
- Parameters:
- model (
Any) – the model in which to infer (pyagrum.BayesNet, pyagrum.MarkovRandomField or pyagrum.InfluenceDiagram) - filename (
str|None) – the name of the resulting file (suffix in [‘pdf’, ‘png’, ‘ps’]). If filename is None, the result is a np.array ready to be used with imshow(). - engine (pyagrum.BNInference | pyagrum.MRFInference | pyagrum.CNInference | pyagrum.IDInference) – inference algorithm used. If None, pyagrum.LazyPropagation will be used for BayesNet,pyagrum.ShaferShenoy for pyagrum.MarkovRandomField and pyagrum.ShaferShenoyLIMIDInference for pyagrum.InfluenceDiagram.
- evs (dict *[*str *,*str *|*int ]) – map of evidence
- targets (Set *[*str *|*int ]) – set of targets
- size (str) – size of the rendered graph
- nodeColor (dict *[*int *,*float ]) – a nodeMap of values (between 0 and 1) to be shown as color of nodes (with special colors for 0 and 1)
- factorColor (dict *[*int *,*float ]) – a nodeMap of values (between 0 and 1) to be shown as color of factors (in MarkovRandomField representation)
- arcWidth (dict [ *(*int *,*int ) *,*float ]) – a arcMap of values to be shown as width of arcs
- arcColor (dict [ *(*int *,*int ) *,*float ]) – a arcMap of values (between 0 and 1) to be shown as color of arcs
- cmap (matplotlib.colors.ColorMap) – color map to show the color of nodes and arcs
- cmapArc (matplotlib.colors.ColorMap) – color map to show the vals of Arcs.
- graph (pyagrum.Graph) – only shows nodes that have their id in the graph (and not in the whole BN)
- view (str) – graph | factorgraph | None (default) for Markov random field
- model (
- Returns: the desired representation of the inference
- Return type:
Any