Different sampling inference
 |  |  |
%matplotlib inlinefrom pylab import *import matplotlib.pyplot as plt
import warnings
warnings.simplefilter("error")
import pyagrum as gum
bn = gum.loadBN("res/Diabetes.bif")## gnb.showBN(bn,size='8')print(bn)BN{nodes: 413, arcs: 602, domainSize: 10^406.108, dim: 429409, mem: 3Mo 530Ko 104o}First, some helpers
Section titled “First, some helpers”import timeit
class Timer: def __enter__(self): self.start = timeit.default_timer() return self
def __exit__(self, *args): self.end = timeit.default_timer() self.duration = self.end - self.startdef execute(ie): with Timer() as t: ie.makeInference() for i in bn.nodes(): a = ie.posterior(i) return "duration : {:3.3f}s".format(t.duration)
def vals(bn, ie): exact = [] appro = [] for node in bn.nodes(): # Tensor as float list exact += ie.posterior(node).tolist()
return exactExact inference.
Section titled “Exact inference.”import matplotlib_inline
matplotlib_inline.backend_inline.set_matplotlib_formats("png")
plt.rcParams["figure.figsize"] = [30, 3]
def compareIE(bn, maxtime, epsilon, evs=None): ie = gum.LazyPropagation(bn) if evs is not None: ie.setEvidence(evs) x = vals(bn, ie)
ie2 = gum.GibbsSampling(bn) if evs is not None: ie2.setEvidence(evs) ie2.setMaxTime(maxtime) ie2.setEpsilon(epsilon) txt = "Gibbs : " + execute(ie2) + "\n" + ie2.messageApproximationScheme() y = vals(bn, ie2) plt.subplot(181) plt.plot(x, y, "ro") plt.title(txt)
ie3 = gum.MonteCarloSampling(bn) if evs is not None: ie3.setEvidence(evs) ie3.setMaxTime(maxtime) ie3.setEpsilon(epsilon) txt = "MonteCarlo : " + execute(ie3) + "\n" + ie3.messageApproximationScheme() y = vals(bn, ie3) plt.subplot(182) plt.plot(x, y, "ro") plt.title(txt)
ie4 = gum.WeightedSampling(bn) if evs is not None: ie4.setEvidence(evs) ie4.setMaxTime(maxtime) ie4.setEpsilon(epsilon) txt = "Weighted : " + execute(ie4) + "\n" + ie4.messageApproximationScheme() y = vals(bn, ie4) plt.subplot(183) plt.plot(x, y, "ro") plt.title(txt)
ie5 = gum.ImportanceSampling(bn) if evs is not None: ie5.setEvidence(evs) ie5.setMaxTime(maxtime) ie5.setEpsilon(epsilon) txt = "Importance: " + execute(ie5) + "\n" + ie5.messageApproximationScheme() y = vals(bn, ie5) plt.subplot(184) plt.plot(x, y, "ro") plt.title(txt)
ie6 = gum.LoopyBeliefPropagation(bn) if evs is not None: ie6.setEvidence(evs) ie6.setMaxTime(maxtime) ie6.setEpsilon(epsilon) txt = "LBP: " + execute(ie6) + "\n" + ie6.messageApproximationScheme() y = vals(bn, ie6) plt.subplot(185) plt.plot(x, y, "ro") plt.title(txt)
ie7 = gum.LoopyWeightedSampling(bn) if evs is not None: ie7.setEvidence(evs) ie7.setMaxTime(maxtime) ie7.setEpsilon(epsilon) txt = "LoopyWeighted: " + execute(ie7) + "\n" + ie7.messageApproximationScheme() y = vals(bn, ie7) plt.subplot(186) plt.plot(x, y, "ro") plt.title(txt)
ie8 = gum.LoopyGibbsSampling(bn) if evs is not None: ie8.setEvidence(evs) ie8.setMaxTime(maxtime) ie8.setEpsilon(epsilon) txt = "LoopyGibbs: " + execute(ie8) + "\n" + ie8.messageApproximationScheme() y = vals(bn, ie8) plt.subplot(187) plt.plot(x, y, "ro") plt.title(txt)
ie9 = gum.LoopyImportanceSampling(bn) if evs is not None: ie9.setEvidence(evs) ie9.setMaxTime(maxtime) ie9.setEpsilon(epsilon) txt = "LoopyImportance: " + execute(ie9) + "\n" + ie9.messageApproximationScheme() y = vals(bn, ie9) plt.subplot(188) plt.plot(x, y, "ro") plt.title(txt)
plt.show()compareIE(bn, 5, 1e-2)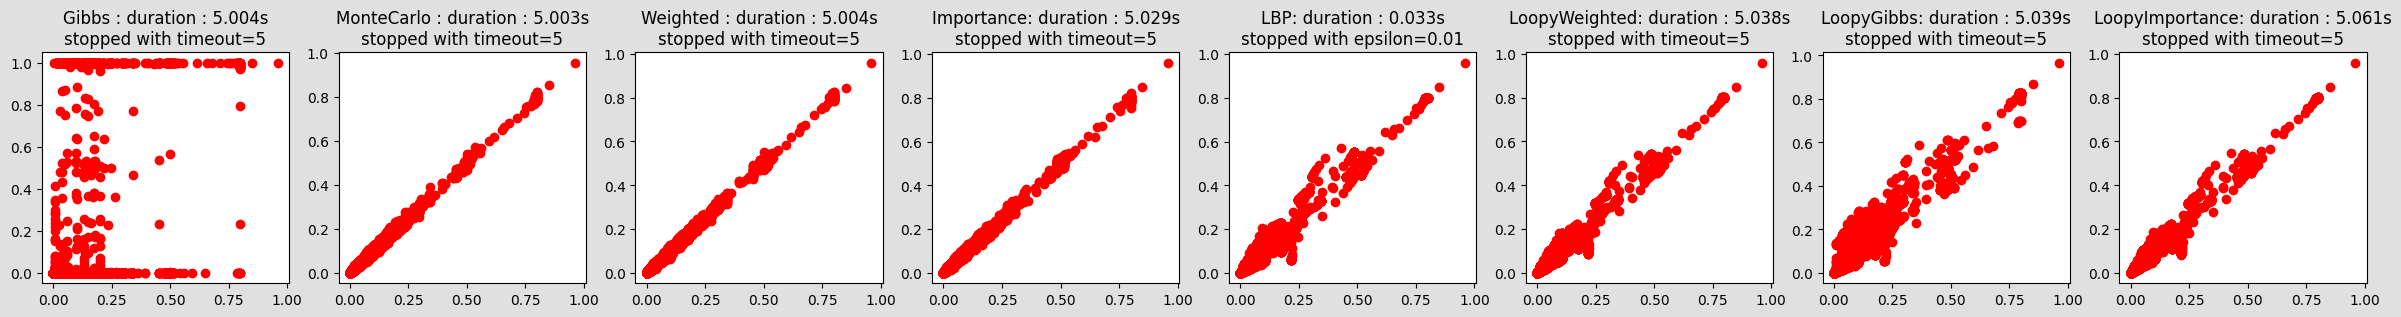
compareIE(bn, 50, 1e-2)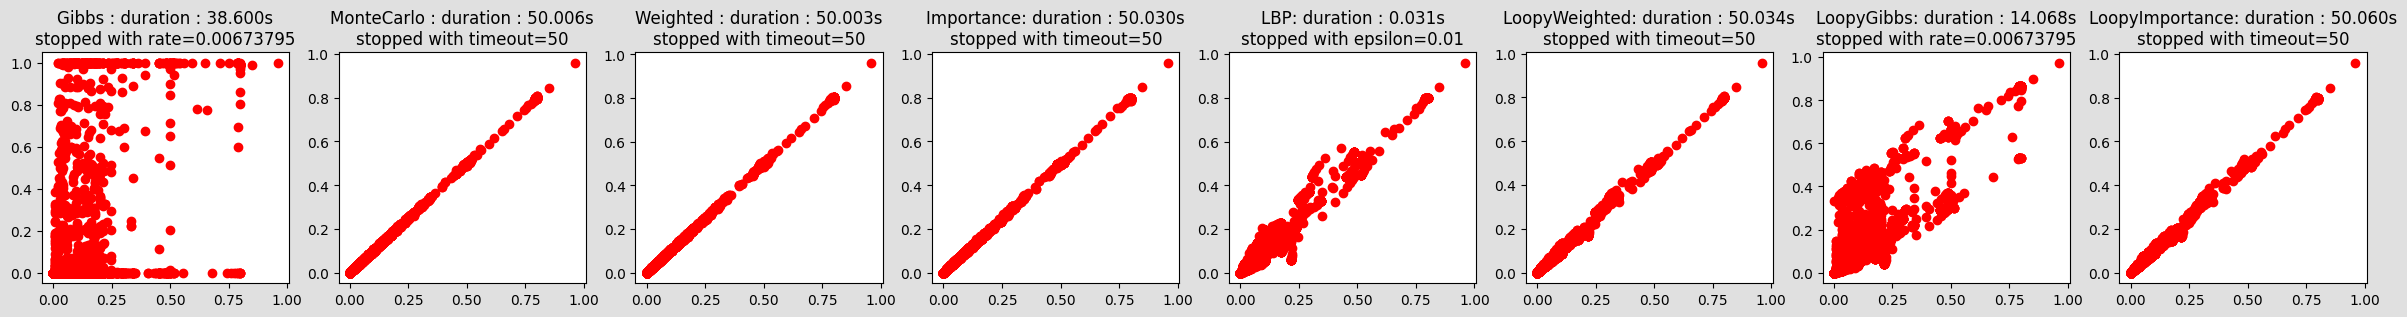
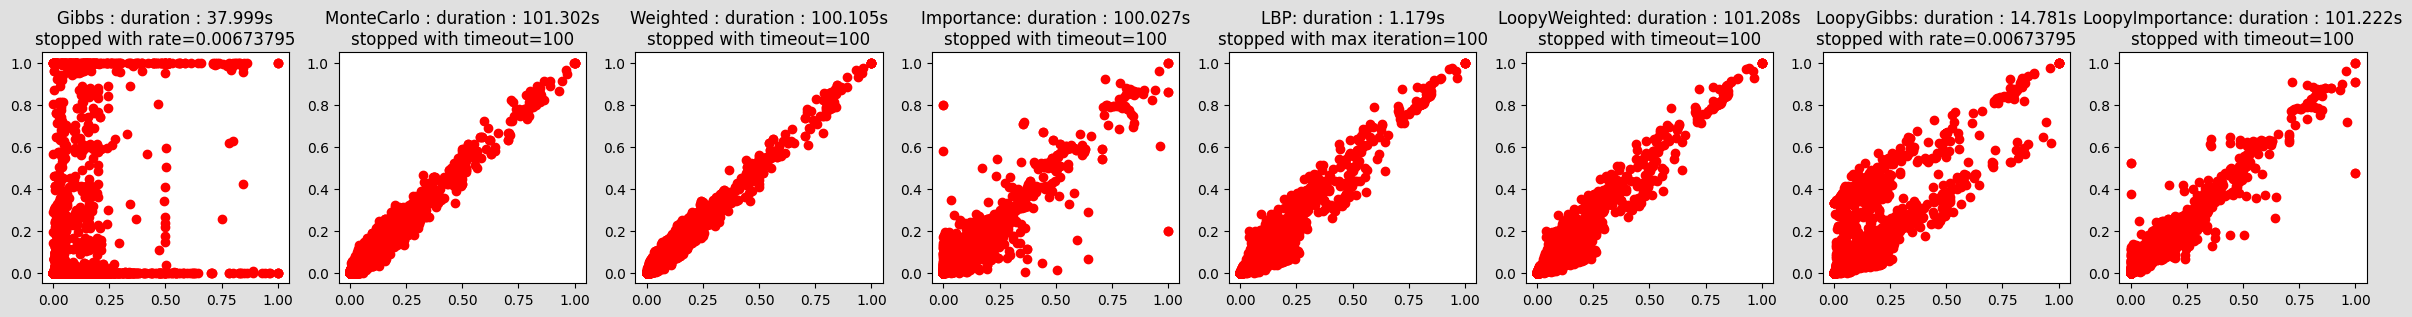
compareIE(bn, 5, 1e-2, evs={"bg_24": 0, "ins_indep_util_23": 1, "renal_cl_14": 1})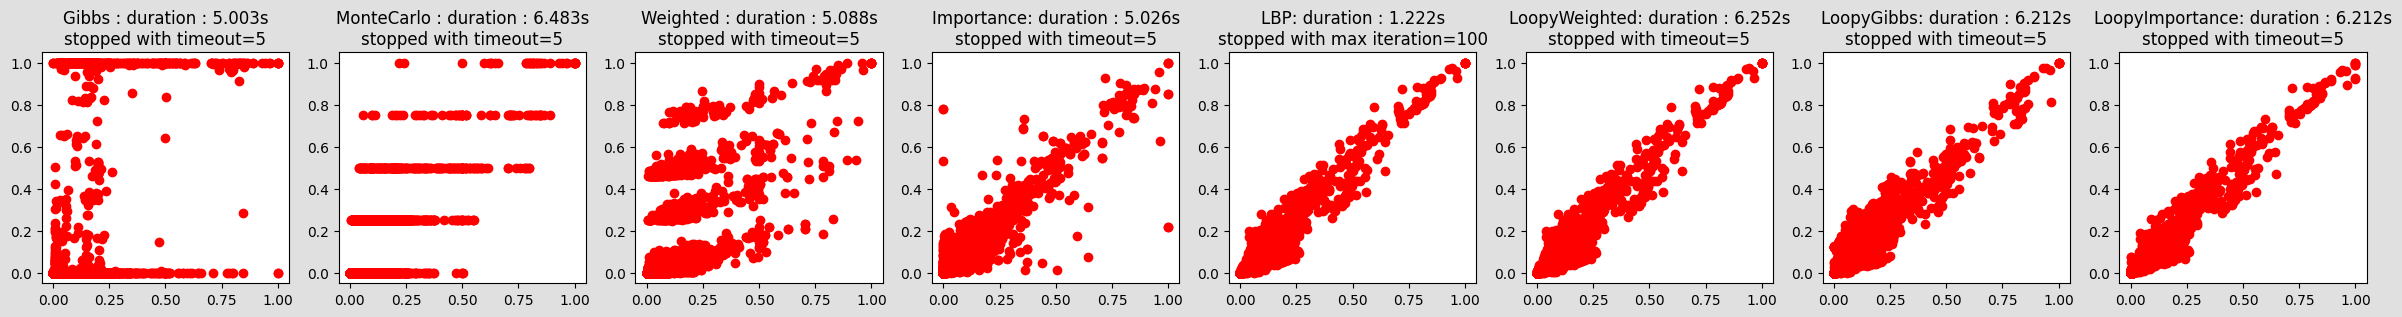
compareIE(bn, 100, 1e-2, evs={"bg_24": 0, "ins_indep_util_23": 1, "renal_cl_14": 1})