


Customizing and exporting graphical models and CPTs as image (pdf, png)
 |  |  |
from pylab import *import matplotlib.pyplot as pltimport pyagrum as gumimport pyagrum.lib.notebook as gnbbn = gum.fastBN("a->b->c->d;b->e->d->f;g->c")gnb.flow.row(bn, gnb.getInference(bn))customizing colours and width for model and inference
Section titled “customizing colours and width for model and inference”def nodevalue(n): return 0.5 if n in "aeiou" else 0.7
def arcvalue(a): return (10 - a[0]) * a[1]
def arcvalue2(a): return (a[0] + a[1] + 5) / 22
gnb.showBN( bn, nodeColor={n: nodevalue(n) for n in bn.names()}, arcWidth={a: arcvalue(a) for a in bn.arcs()}, arcLabel={a: f"v={arcvalue(a):02d}" for a in bn.arcs()}, arcColor={a: arcvalue2(a) for a in bn.arcs()},)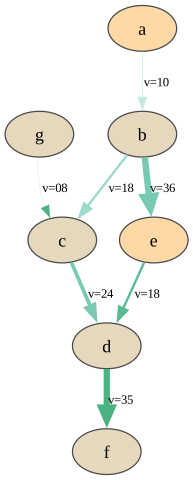
gnb.showInference( bn, targets={"a", "g", "f", "b"}, evs={"e": 0}, nodeColor={n: nodevalue(n) for n in bn.names()}, arcWidth={a: arcvalue(a) for a in bn.arcs()},)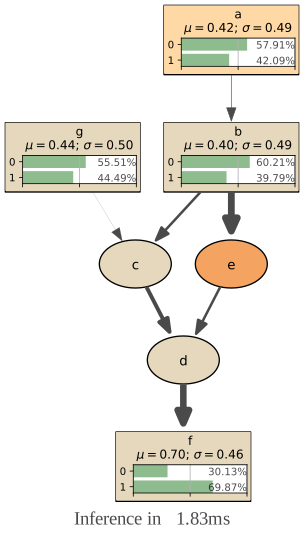
gnb.flow.row( gnb.getBN(bn, nodeColor={n: nodevalue(n) for n in bn.names()}, arcWidth={a: arcvalue(a) for a in bn.arcs()}), gnb.getInference(bn, nodeColor={n: nodevalue(n) for n in bn.names()}, arcWidth={a: arcvalue(a) for a in bn.arcs()}),)mycmap = plt.get_cmap("Reds")formyarcs = plt.get_cmap("winter")gnb.flow.row( gnb.getBN( bn, nodeColor={n: nodevalue(n) for n in bn.names()}, arcColor={a: arcvalue2(a) for a in bn.arcs()}, cmapNode=mycmap, cmapArc=formyarcs, ), gnb.getInference( bn, nodeColor={n: nodevalue(n) for n in bn.names()}, arcColor={a: arcvalue2(a) for a in bn.arcs()}, arcWidth={a: arcvalue(a) for a in bn.arcs()}, cmapNode=mycmap, cmapArc=formyarcs, ),)Modifying graph’s layout
Section titled “Modifying graph’s layout”Every graph or graphical models can be translated into a pyDot’s representaton (a pydot.Dot object). In this graphical representation, it is possible to manipulate the positions of the node. pyAgrum proposes two functions gum.utils.dot_layout to help modifying this layout.
Layout for Bayesian network
Section titled “Layout for Bayesian network”import pyagrum as gumimport pyagrum.lib.notebook as gnbimport pyagrum.lib.utils as gutilsimport pyagrum.lib.bn2graph as gumb2g
bn = gum.fastBN("A->B<-C<-D")bn2 = gum.fastBN("A->B->C<-D")
graph = gumb2g.BN2dot(bn)
graph2 = gumb2g.BN2dot(bn2)l = gutils.dot_layout(graph)print(f"Layout proposed by dot for BN :{l}")gutils.apply_dot_layout(graph2, l)
graph3 = gumb2g.BN2dot(bn2)## l["C"],l["A"]=l["A"],l["C"]l["D"], l["C"], l["B"], l["A"] = ( gutils.DotPoint(0, 0), gutils.DotPoint(1, 1), gutils.DotPoint(2, 2), gutils.DotPoint(3, 3),)gutils.apply_dot_layout(graph3, l)gnb.flow.row(bn, bn2, graph2, graph3, captions=["BN", "BN2", "BN2 with the same layoutas BN", "Layout changed by hand"])Layout proposed by dot for BN :{'A': DotPoint(x=0.375, y=1.25), 'B': DotPoint(x=0.875, y=0.25), 'C': DotPoint(x=1.375, y=1.25), 'D': DotPoint(x=1.375, y=2.25)}Layout for other graphical models and for inference
Section titled “Layout for other graphical models and for inference”import pyagrum as gumimport pyagrum.lib.notebook as gnbimport pyagrum.lib.utils as gutilsimport pyagrum.lib.id2graph as gum2gr
model = gum.fastID("*D->$L<-E<-H->L;E->D")gnb.flow.add(model)gum.config.push()gum.config["influenceDiagram", "utility_shape"] = "diamond"
figure = gum2gr.ID2dot(model)l = gutils.dot_layout(figure)
## changing LAYOUT## making some horizontal spacefor i, p in l.items(): l[i] = gutils.DotPoint(1.5 * p.x, p.y)## E at the vertical of L, at the horizontal of Dl["E"] = gutils.DotPoint(l["L"].x, l["D"].y)## H symetric of D w.r.t (EL)l["H"] = gutils.DotPoint(2 * l["E"].x - l["D"].x, l["D"].y)
gutils.apply_dot_layout(figure, l)gnb.flow.add(figure)
gnb.flow.display()gum.config.pop()import pyagrum as gumimport pyagrum.lib.notebook as gnbimport pyagrum.lib.utils as gutilsimport pyagrum.lib.id2graph as gum2gr
model = gum.fastID("*D->$L<-E<-H->L;E->D")gnb.flow.add(gnb.getInference(model))
figure = gum2gr.LIMIDinference2dot(model, evs={}, targets={}, size=None, engine=None)l = gutils.dot_layout(figure)
## changing LAYOUT## making some horizontal spacefor i, p in l.items(): l[i] = gutils.DotPoint(3 * p.x, p.y)## E at the vertical of L, at the horizontal of Dl["E"] = gutils.DotPoint(l["L"].x, l["D"].y)l["D"] = gutils.DotPoint(l["D"].x / 2, l["D"].y)l["H"] = gutils.DotPoint(l["L"].x * 3 / 2, l["D"].y)
gutils.apply_dot_layout(figure, l)gnb.flow.add(figure)
gnb.flow.display()Exporting model and inference as image
Section titled “Exporting model and inference as image”Exporting as image (pdf, png, etc.) has been gathered in 2 functions : pyagrum.lib.image.export() and pyagrum.lib.image.exportInference(). The argument are the same as for pyagrum.notebook.show{Model} and pyagrum.notebook.show{Inference}.
import osimport pyagrum.lib.image as gumimagefrom IPython.display import Image  # to display the exported images
os.makedirs("out/export", exist_ok=True)
gumimage.export(bn, "out/export/test_export.png")
Image(filename="out/export/test_export.png")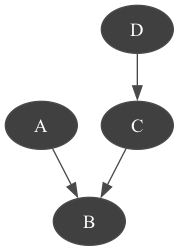
bn = gum.fastBN("a->b->d;a->c->d[3]->e;f->b")gumimage.export(  bn,  "out/export/test_export.png",  nodeColor={"a": 1, "b": 0.3, "c": 0.4, "d": 0.1, "e": 0.2, "f": 0.5},  arcColor={(0, 1): 0.2, (1, 2): 0.5},  arcWidth={(0, 3): 0.4, (3, 2): 0.5, (2, 4): 0.6},)
Image(filename="out/export/test_export.png")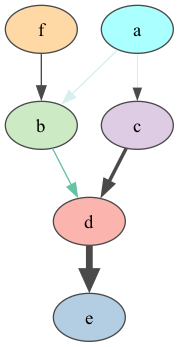
gumimage.exportInference(bn, "out/export/test_export.png")
Image(filename="out/export/test_export.png")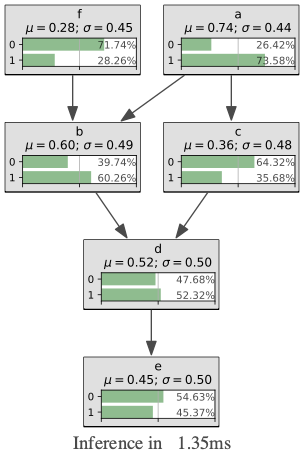
gumimage.export(bn, "out/export/test_export.pdf")Link to out/export/test_export.pdf
exporting inference with evidence
Section titled “exporting inference with evidence”bn = gum.loadBN("res/alarm.bgum")gumimage.exportInference( bn, "out/export/test_export.pdf", evs={"CO": 1, "VENTLUNG": 1}, targets={ "VENTALV", "CATECHOL", "HR", "MINVOLSET", "ANAPHYLAXIS", "STROKEVOLUME", "ERRLOWOUTPUT", "HBR", "PULMEMBOLUS", "HISTORY", "BP", "PRESS", "CO", }, size="15!",)Link to out/export/test_export.pdf
Other models
Section titled “Other models”Other models can also use these functions.
infdiag = gum.loadID("res/OilWildcatter.bgum")gumimage.export(infdiag, "out/export/test_export.pdf")Link to out/export/test_export.pdf
gumimage.exportInference(infdiag, "out/export/test_export.pdf")Link to out/export/test_export.pdf
Exporting any object with toDot() method
Section titled “Exporting any object with toDot() method”obs1 = gum.fastBN("Smoking->Cancer")modele3 = gum.CausalModel(obs1, [("Genotype", ["Smoking", "Cancer"])], True)gumimage.export(modele3, "out/export/test_export.png") # a causal model has a toDot method.Image(filename="out/export/test_export.png")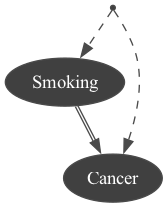
bn = gum.fastBN("a->b->c->d;b->e->d->f;g->c")ie = gum.LazyPropagation(bn)jt = ie.junctionTree()gumimage.export(jt, "out/export/test_export.png") # a JunctionTree has a method jt.toDot()Image(filename="out/export/test_export.png")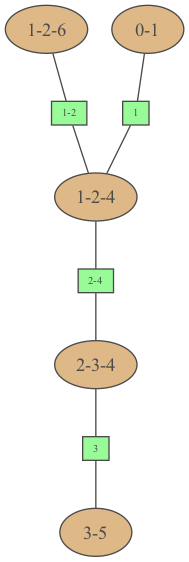
… or even a string in dot syntax
Section titled “… or even a string in dot syntax”gumimage.export( jt.toDotWithNames(bn), "out/export/test_export.png") # jt.toDotWithNames(bn) creates a dot-string for a junction tree with names of variablesImage(filename="out/export/test_export.png")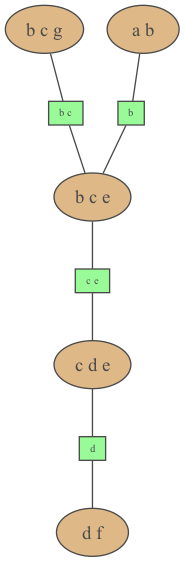
Exporting to pyplot
Section titled “Exporting to pyplot”import matplotlib.pyplot as plt
bn = gum.fastBN("A->B->C<-D")
plt.imshow(gumimage.export(bn))plt.show()
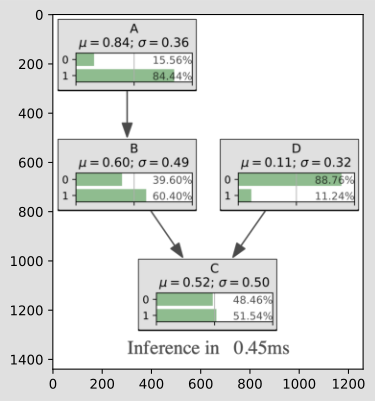
plt.imshow(gumimage.exportInference(bn, size="15!"))plt.show()
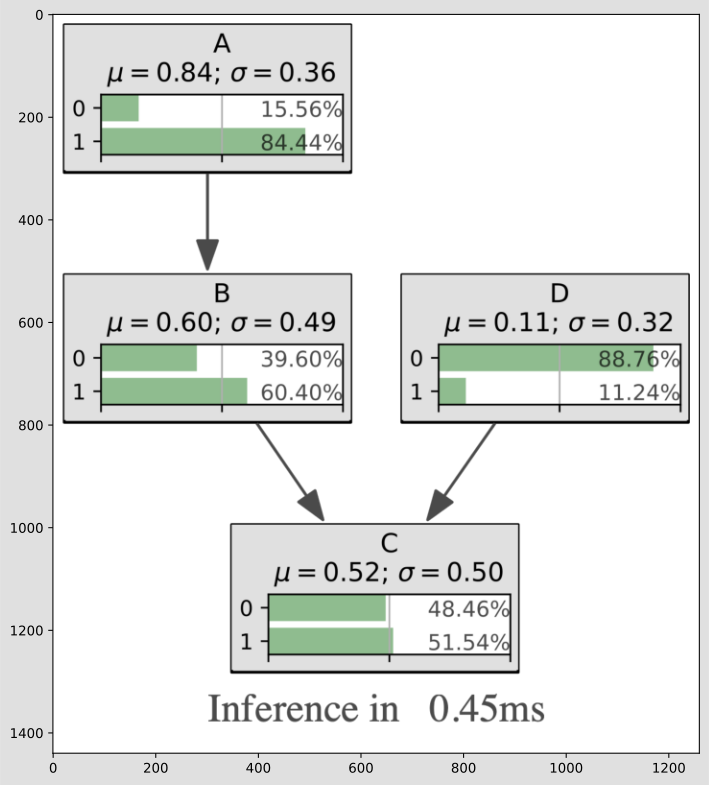
plt.figure(figsize=(10, 10))plt.imshow(gumimage.exportInference(bn, size="15!"))plt.show()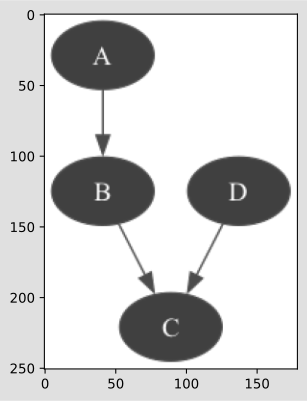
Exporting CPTs and HTML views
Section titled “Exporting CPTs and HTML views”pyagrum.lib.image.export() handles any object with a _repr_html_() method
(CPTs, inspectBN, sideBySide, explain.Information…) in addition to graphical models.
bn = gum.fastBN("A->B<-C", 3)gumimage.export(bn.cpt("B"), "out/export/cpt_B_.pdf")gumimage.export(gnb.getSideBySide(bn, bn.cpt("A"), bn.cpt("B"), bn.cpt("C")), "out/export/sideBySide.pdf")import pyagrum.explain as gexplain
gumimage.export(gexplain.getInformation(bn), "out/export/informationBN.pdf")gumimage.export(gnb.inspectBN(bn), "out/export/inspectBN.pdf")Adjusting PDF margins
Section titled “Adjusting PDF margins”PDF export adds margins around the content (default: 50px horizontal, 37px vertical).
These can be changed via gum.config — using push/pop to restore defaults afterwards.
gum.config.push()gum.config.typed["notebook", "export_pdf_margin_x"] = 10gum.config.typed["notebook", "export_pdf_margin_y"] = 10gumimage.export(bn.cpt("B"), "out/export/cpt_B_tight.pdf")gum.config.pop()gum.config.push()gum.config.typed["notebook", "export_pdf_margin_x"] = 30gum.config.typed["notebook", "export_pdf_margin_y"] = 30gumimage.export(gnb.inspectBN(bn), "out/export/tootight_inspectBN.pdf")gum.config.pop()